
Cover: starlings over the Sijoumi sabkha, Tunisia, photographed by Skander Zarrad, 2021. CC BY-SA 4.0; resized and compressed, with the displayed crop set by the journal. The photograph illustrates collective form, not evidence for a market theory.

A market chart becomes remarkably orderly once we know what happened next. The rally acquires a beginning, an acceleration and an exhausted final push. The decline resolves into stages. What felt uncertain while unfolding can look almost inevitable when annotated afterwards.
That transformation raises a difficult question. Have we discovered an order that was present all along, or supplied one through our choice of turning points?
Two books make this question unusually ambitious. A. J. Frost and Robert Prechter's Elliott Wave Principle presents a grammar of market movement. Prechter's The Wave Principle of Human Social Behavior and the New Science of Socionomics extends that grammar into an account of collective psychology, culture and history. Read together, they ask whether the apparently disconnected movements of prices, public confidence and social behaviour might be expressions of a deeper process.
Their attraction deserves more than a quick endorsement or dismissal. Markets are social systems. Their participants observe one another, imitate, disagree, borrow, panic and change their minds. But recognising that complexity does not tell us whether it produces a particular five-wave sequence, a reliable Fibonacci target or a measurable law of historical change.
The distinction between those claims is where the investigation becomes interesting.
A grammar discovered in the wreckage
Ralph Nelson Elliott developed his ideas during the 1930s, studying the market's movements after illness interrupted his working life. The historical account in Frost and Prechter's book describes painstaking examination of the Dow averages, correspondence with Charles Collins and the eventual publication of The Wave Principle in 1938. Its memorable successful forecasts belong to that history. They are not, by themselves, a complete record of forecasting performance. [Book 1, foreword, pp. 11–14.]
Elliott's proposition was subtler than a calendar cycle. The repeated element was form, not a fixed duration or amplitude. An advance could be large or small, quick or prolonged, while retaining a recognisable relationship among its parts. Frost and Prechter make this distinction near the outset. [Book 1, p. 19.]
This matters because calling Elliott a cycle theorist can suggest a regular clock. His model is closer to a language: a limited set of structures, combined at different scales, is supposed to organise an enormous variety of paths. A wave is intelligible partly through its position in a larger wave.
The book therefore sits beside conventional technical analysis while asking for more. A wedge, triangle or momentum divergence becomes a component of a proposed larger structure. Dow Theory, volume, breadth and other indicators can support an interpretation, but the wave count supplies its organising framework. That makes the theory richer than a single chart pattern and harder to test as a single rule. [Book 1, chapter 7.]
What five and three actually mean
The familiar introductory picture contains five waves in the direction of the larger trend, followed by three waves against it. In an upward impulse, waves 1, 3 and 5 advance; 2 and 4 interrupt them. A subsequent correction is labelled A, B and C. On a larger chart, the entire sequence may become just two components of another pattern.
“Motive” does not always mean rising, and “corrective” does not always mean falling. Their meaning depends on the next larger trend. Nor is a wave degree a fixed interval such as one hour or one year. Degree identifies relative structural scale, and the authors acknowledge that it can be uncertain while a pattern develops. [Book 1, pp. 21–31.]
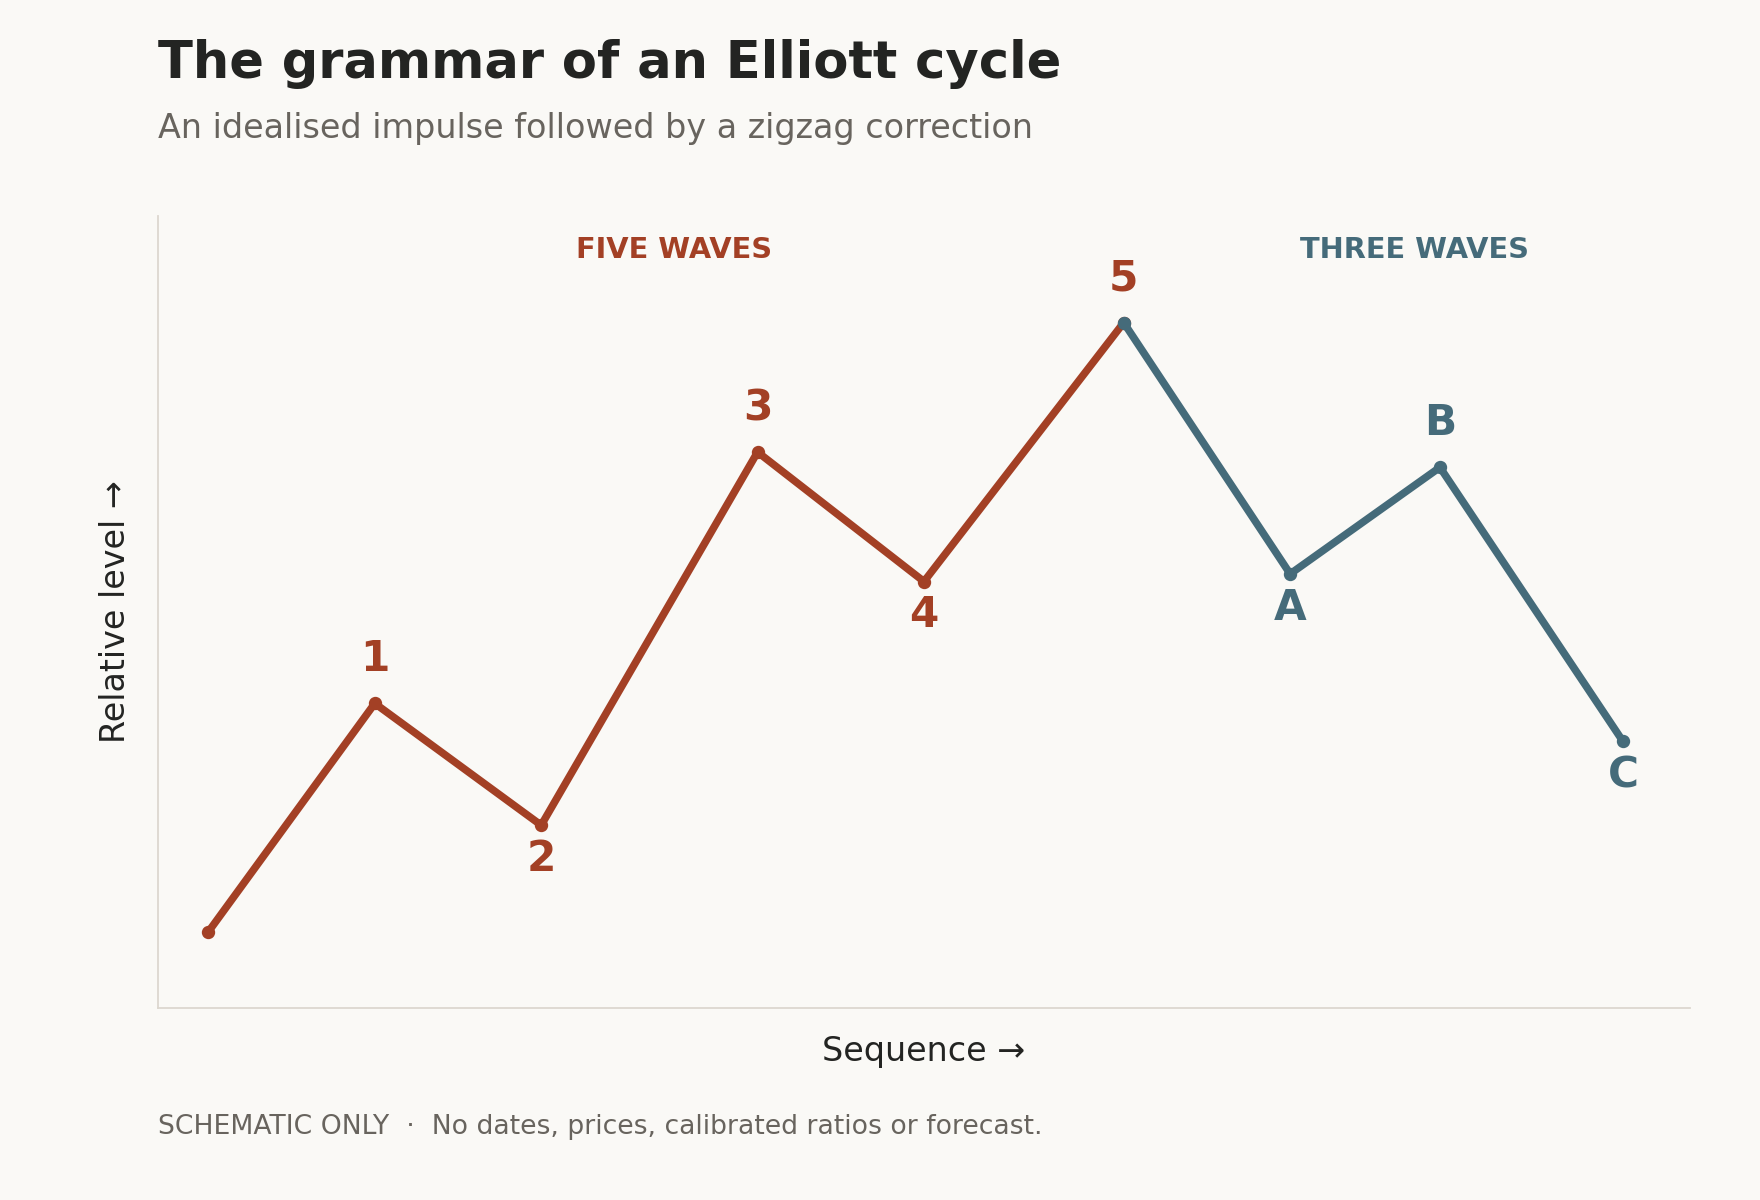
Figure 1. Original schematic, based on the definitions in Book 1. No historical prices or calibrated ratios are shown. The three-line correction represents a zigzag at this scale, not every corrective pattern.
An ordinary impulse has restrictions. Wave 2 cannot retrace beyond the start of wave 1. Wave 3 cannot be the shortest of waves 1, 3 and 5; it need not be the longest. Wave 4 normally cannot enter wave 1's price territory. Diagonals have different overlap rules, and the book contains qualifications concerning observed market data. A computational test has to state precisely which version it implements.
The apparent simplicity soon branches. An extension gives one motive wave conspicuous internal subdivisions. A truncation means a fifth wave fails to exceed the third-wave extreme. A diagonal is a motive wedge, with overlapping components, that may occur at specified beginning or ending positions. These are meaningful distinctions within the framework, not interchangeable names for any inconvenient price movement. [Book 1, pp. 31–40.]
Corrections are more varied still. A zigzag has a 5–3–5 internal structure; a flat, 3–3–5. A triangle contains five labelled legs, usually each subdividing into three. Combinations join corrective structures with connecting waves. Consequently, “five up, three down” is an introduction, not an adequate statement of the theory. [Book 1, pp. 41–54.]
The authors also distinguish rules from guidelines. Alternation suggests that a sharp second-wave correction may be followed by a more sideways fourth. Equality, channels, volume and characteristic emotional narratives help rank alternatives. These are tendencies within the authors' account, not independently established psychological stages.
The difficulty is explicit in the source. Corrections may become recognisable only after completion, and several counts can satisfy the rules simultaneously. Preferred and alternative counts are part of the method. The book also says the principle is not a complete trading system. A fair assessment must retain those qualifications, then ask whether the preferred counts actually earn better probabilities. [Book 1, pp. 41, 78, 94–97.]
The distance between a fractal and a forecast
Nested waves invite comparison with fractals: structures whose properties recur across scales. Fibonacci arithmetic adds another attraction. Successive numbers in the sequence 1, 1, 2, 3, 5, 8 and onward approach a ratio of about 1.618. The reciprocal is about 0.618. Those relationships enter the books' discussion of wave lengths and retracements.
The arithmetic is exact. Its application to a market is an empirical claim. If a model is constructed recursively, Fibonacci counts within that model cannot serve as independent evidence that actual markets obey it. The books range widely across biological growth, proportions and natural forms, but a shared number does not identify a shared causal mechanism. Frost and Prechter themselves call retracement relationships tendencies and give wave form priority over ratios. [Book 1, chapters 3–4, especially pp. 127, 135 and 147.]
Benoit Mandelbrot's contribution to finance was not the discovery of Elliott's grammar. With Adlai Fisher and Laurent Calvet, his 1997 Multifractal Model of Asset Returns described stochastic scaling across time horizons. Such models can contain persistent variation in the size of movements without corresponding predictability in their sign. Knowing that turbulence tends to cluster is different from knowing which way the next move will go. The named Fractal Market Hypothesis is associated with Edgar Peters; it should not be conflated with either Elliott counting or Mandelbrot's particular models. (3, 4)
More recent measurement is equally careful. Tetsuya Takaishi's 2025 study of Bitcoin volatility finds that estimated roughness and multifractality depend on sampling and finite-sample effects. It supports investigating scaling properties, not announcing a Fibonacci destination. (5)
A foundational component test is less encouraging for the ratios. Roy Batchelor and Richard Ramyar's 2006 working paper examined whether successive Dow trends clustered around Fibonacci or round-number relationships. Using mechanical turning points and a block-bootstrap comparison, they found no more significant ratios than chance would suggest across the many tests. This is evidence against that operationalisation of ratio clustering, not a refutation of every possible wave rule. (6)

Figure 2. Von Kármán vortices, Landsat 7, USGS Earth Resources Observation and Science Center. Source and public-domain notice. Resized and compressed; original plate retained. These spirals arise from fluid flow around obstacles. Their resemblance to other natural forms does not establish Fibonacci control of markets.
Power laws require the same discipline. Clauset, Shalizi and Newman's 2009 SIAM Review paper shows why a visually convincing line on logarithmic axes is insufficient: fit, goodness-of-fit and competing distributions need separate tests. Their examples span many systems, not an Elliott forecast test. (24)
Self-organised criticality is a proposed mechanism, not another name for any complex pattern. Bak, Tang and Wiesenfeld's 1987 model showed how interacting systems can approach a critical state with scale-invariant behaviour. Extending that idea to finance requires identifying and testing the market mechanism. A power-law fit alone cannot select it over competing explanations, and neither result would establish five-wave/three-wave ordering. (25)
This is the central separation: statistical self-similarity, a specific wave grammar and useful prediction are three different propositions. Evidence for the first does not automatically travel to the other two.
When a market theory becomes a theory of society
The second book makes a larger move. Markets cease to be the main object and become an unusually fast expression of something beneath them: social mood.
Prechter proposes an aggregate, largely unconscious disposition toward optimism or pessimism, confidence or fear, inclusion or exclusion. Under uncertainty, people orient themselves partly through others. Their interactions generate collective tendencies that need not originate in a single announcement or decision.
In this account, buying a share can express mood almost immediately. Choosing a song or film may also express it quickly. Building a factory, passing legislation or organising conflict takes longer. Financial prices might therefore coincide with mood while preceding slower social actions. The thesis is not simply that the Dow causes peace or that a falling index produces a dark film. Prices and cultural behaviour are proposed as expressions of a common underlying process. [Book 2, chapters 14–16, especially pp. 227–239 and 259–263.]
| Elliott Wave Principle | The Wave Principle of Human Social Behavior | |
|---|---|---|
| Main ambition | Describe and anticipate market structure | Explain collective behaviour and historical change |
| Central object | Nested price patterns | Endogenous social mood expressed across domains |
| Hardest test | Recognise patterns before their outcomes | Measure mood independently and establish causal direction |
This extension is already foreshadowed in the first book's discussion of news. The second develops it through cultural examples, biology, computational models and a proposed distinction between ordinary consumption and speculative finance. Rising prices can discourage consumption while attracting speculative buyers who infer that others know something. Positive feedback becomes central to the story. [Book 1, p. 192; Book 2, chapter 20.]
Its intellectual appeal lies in taking collective dynamics seriously. Its difficulty lies in moving from plausible interaction to a particular universal form.
Prechter's own concept of a “robust fractal” is more restrictive than generic statistical self-similarity: recognisable component structures survive variation. His discussion of music, films and fashion also acknowledges limited cultural data. At one point he describes choosing between nominal and inflation-adjusted market charts according to which better illustrates a relationship. That choice is precisely what a prospective test would need to settle before seeing the result. [Book 2, pp. 55–60 and 237–239.]
There are limits within markets too. The first book favours broad averages over many individual shares, allows distinctive commodity behaviour and offers a Treasury-bond chart as an application. Its very long historical reconstructions combine unlike price measures. None of those examples is equivalent to a uniform statistical validation across stocks, bonds, commodities and centuries. [Book 1, chapters 5–7.]
The arrow that carries the greatest weight
Saying that mood influences behaviour is a modest claim compared with saying that an autonomous mood process generates the events commonly assumed to influence it.
Prechter advances the stronger claim. In chapter 18, models capable of generating instability without external shocks become part of an argument against external causation itself. The inference is consequential: showing that a crash can arise internally does not establish that actual prices cannot respond to outside information. Sufficiency is not exclusivity. [Book 2, pp. 323–330.]
Modern complexity research supplies useful alternatives. Sarah Mignot and Frank Westerhoff's agent-based exchange-rate model, published online in 2024 and in Computational Economics in 2025, generates bubbles, crashes, fat tails and clustered volatility from interacting technical and fundamental traders. It does not impose Elliott's grammar. The simulation demonstrates a possible mechanism, not that its agents uniquely describe real markets. (7)
Herding itself need not require a universal emotional clock. Bikhchandani, Hirshleifer and Welch's informational-cascade model shows how people can rationally follow earlier actions while setting aside their own information. Conformity can become fragile because apparently independent decisions contain little additional evidence. This is a theoretical mechanism, not proof that every crowd or crash works that way. (8)
Conversely, Andersen, Bollerslev, Diebold and Vega's high-frequency research links macroeconomic announcement surprises to jumps in stock, bond and foreign-exchange prices. Responses vary with the economic state. Such evidence challenges an absolute no-news-effect proposition without implying that news explains every movement or that tomorrow's surprise can be known today. (9)
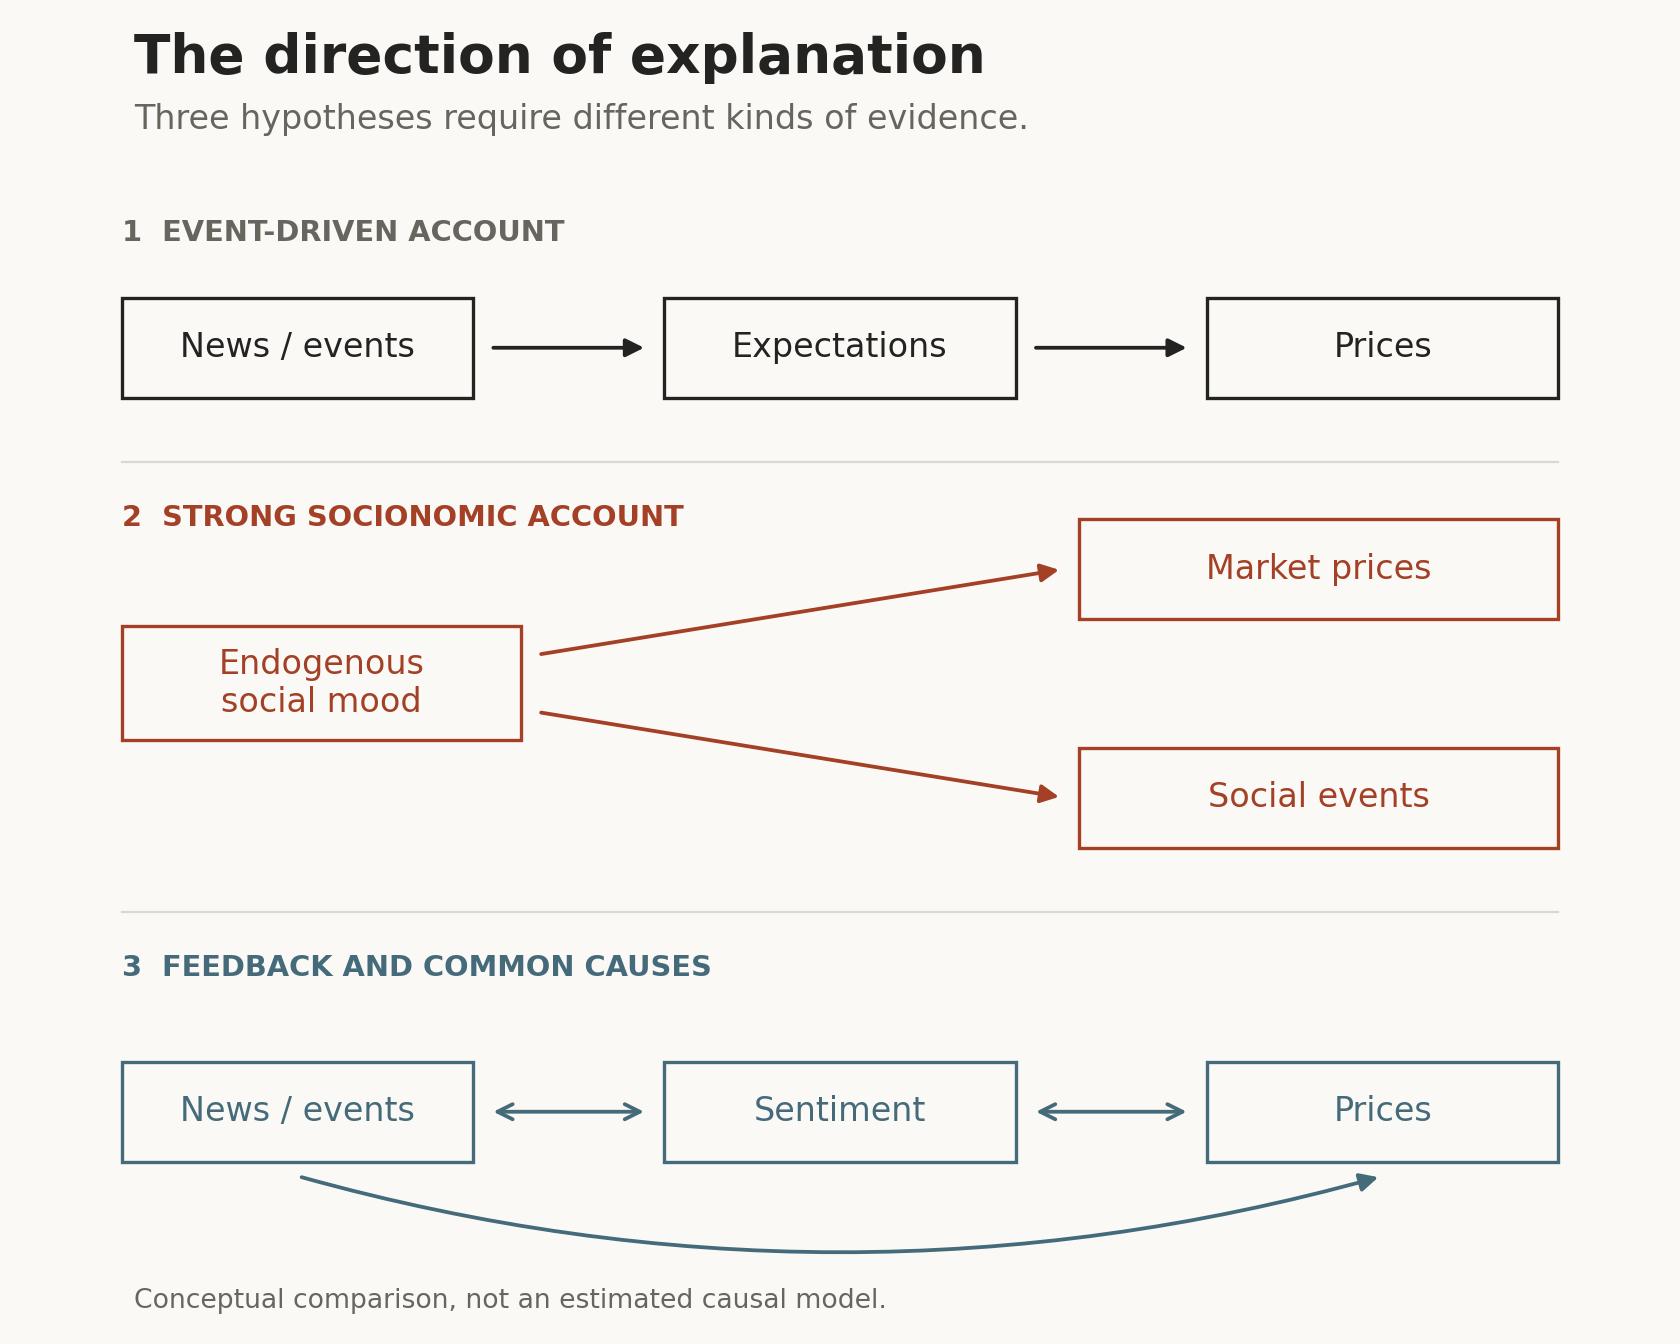
Figure 3. Original conceptual comparison. Arrows identify hypotheses, not estimated effects. Finding that one series leads another cannot, alone, decide among common causes, feedback and a one-way causal process.
Direct socionomic studies should also be read on their own terms. Prechter, Goel, Parker and Lampert's 2012 SAGE Open paper reports a relationship between preceding stock-market performance and incumbent US presidents' reelection vote margins. The relationship did not extend to incumbent-party candidates when the incumbent did not run. It is a real empirical contribution, but one involving proponents of the theory. Mood is inferred from prices; the result does not isolate mood from expectations, wealth effects or other shared influences. (10)
Ketovuori and Lampert's 2018 study in Popular Music finds more pessimism in sampled Finnish chart songs from 2009 than 2006. That supports a specific cultural comparison. It cannot decide whether mood led economic events, events changed musical preferences, or both reflected something else. It is also not wholly independent of the socionomics research community. (11)
The strongest thesis needs independently measured mood and evidence that discriminates among these explanations. A chart of two things moving together is the start of that task.
What recent sentiment research really adds
Behavioural finance gives psychology an important role without requiring an Elliott law of history. Baker and Wurgler's influential synthesis connects sentiment with valuation and limits to arbitrage, particularly for securities that are difficult to value or costly to trade against. Its scope is conditional market behaviour, not a single psychological rhythm governing society. (12)
A particularly inventive measurement appears in Alex Edmans, Adrian Fernandez-Perez, Alexandre Garel and Ivan Indriawan's 2022 Journal of Financial Economics paper. They use the positivity of songs selected on Spotify across 40 countries as a mood proxy. Unlike calling a rising index “optimism,” the measure is built outside market prices. They report positive same-week equity associations and subsequent reversal, consistent with temporary sentiment-related mispricing. Yet listeners are not a representative census of investors, and the observational relationship does not establish an autonomous mood cycle. (13)
The next chapter is essential. Alicia Weiberg and Jan Heldmann's 2026 Finance Research Letters paper reproduces the original 2017–2020 results but extends the analysis into 2021–2024. The following-week reversal disappears; the volatility relationship vanishes; the bond relationship changes sign. The authors suggest a changed macroeconomic environment as one possible explanation, while retaining alternatives. This is evidence that a documented relationship can change, not that emotion has ceased to matter. (14)
Lan Xiang and Wenzhao Wang's 2026 study in the Journal of Financial Research makes measurement itself the subject. Across 18 markets, indicators of what investors feel, say and do have different predictive properties. No measure dominates across markets, horizons and tests. Trading-based measures often perform strongly, but several include prices and technical indicators; they are not independent observations of an underlying collective mind. Reported economic improvements are also limited and mostly statistically insignificant. (15)
A narrower finding can still be valuable. Borgioli, Gallo and Ongari's 2024 ECB working paper combines an Italian Twitter-based mood index with equity returns and volatility. Its out-of-sample models improve volatility forecasts, not return forecasts. That distinction would vanish if the result were summarised merely as “mood predicts markets.” The paper's predictive lead-lag analysis is not experimental identification of causality. (16)
Together, these studies support investigating sentiment with explicit instruments, populations and horizons. They do not establish that one mood variable subsumes confidence, hostility, risk appetite and cultural preference, much less that it follows a fixed wave grammar. Prechter acknowledged incomplete specification of mood's components in the second book. Modern data make that an empirical problem rather than a detail to pass over. [Book 2, p. 227.]
Can a machine remove the interpreter?
Automation seems an obvious answer to subjective counting. A computer can apply the same rules repeatedly and preserve every result. But it can also apply a questionable definition with perfect consistency.
The history within Prechter's book is instructive. Its EWAVES expert system was designed to encode rules and rank possible counts. Prechter acknowledged that initial scoring relied on experience, forecasting performance had not yet been quantified, and a proposed comparison between real and random series remained undone. Encoding the theory was an achievement; validation remained a separate task. [Book 2, pp. 92–97.]
Recent work advances the engineering. Jarusek, Volna and Kotyrba's 2022 Neural Networks paper reports improved simulated foreign-exchange trading when Elliott-derived timing is combined with neural-network forecasts. Its accessible experimental description excludes broker fees and warns that comparisons with other papers do not share experimental conditions. The result is encouraging hybrid evidence, not independently audited net profitability or validation of the entire wave theory. (17)
Swetha and Arya's 2026 IEEE Access paper is even clearer about its target. It combines LSTM autoencoders, clustering, conventional pivots and rule checks, reporting roughly 2.4 times greater wave-detection capacity. That number measures detected structures, not forecasting accuracy. The paper explicitly analyses completed patterns, with past and future information available for structural identification, and leaves predictive forecasting to further work. It is possible to become better at describing history without anticipating its next observation. (18)
J. Christopher Westland's 2024 Scientific Reports study uses fractal and wavelet methods on NFT transactions. Its abstract reports no support for Elliott-like autocycles and unstable fractal fits, while a later conclusion uses more favourable language. The inconsistency should not be hidden. The study does not demonstrate a stable predictive wave law, and illiquid NFTs are not representative of all markets. Nor does wavelet periodicity directly test the complete counting grammar. (19)
Language models offer another route, but another hypothesis. Lopez-Lira and Tang's 2026 Journal of Financial Economics paper finds that models interpreting news headlines capture market responses and some subsequent drift. Its prominent approximately 90% hit rate concerns the non-tradable initial reaction at portfolio-day level, not a readily executable trading success rate. Costs and diminishing strategy returns matter. This research concerns information processing, not confirmation of autonomous social mood or Elliott patterns. (20)
The machine does not remove the scientific question. It makes the definitions, timestamps and benchmarks easier to inspect, if its designers preserve them.
A test that allows the theory to lose
A convincing experiment would begin before the interesting chart exists.
First, freeze the grammar: allowable patterns, pivot thresholds, degrees, alternative counts and invalidation rules. A turning point that requires later bars to confirm it becomes available only after those bars arrive. Record the timestamp when a forecast could actually have been made, not the earlier point where a retrospective label is eventually drawn.
Next, ask analysts and algorithms to work on the same truncated histories. Hide future prices. Preserve their preferred and alternative counts, probabilities, horizons and abstentions. Agreement measures reproducibility, not truth, but persistent disagreement would reveal that the supposedly shared object still depends heavily on its interpreter. No verified universal analyst-agreement statistic is assumed here; this is a proposed experiment.
Forecast evaluation would then separate three outcomes: structural recognition, predictive information and economic usefulness. Compare chronological unseen periods against a random walk, simple trend rules and appropriately matched volatility or regime models. Remove Elliott features from the same machine-learning system to establish whether they add anything beyond its other inputs. Account for overlapping observations, all tried parameters and the costs of acting on signals.
The null models should be difficult opponents. Shuffled data can test some dependencies, but a market with fat tails and clustered volatility should not be judged only against featureless white noise. Surrogate series and block resampling help ask whether wave counts identify anything beyond properties already captured by simpler alternatives.
Several tools for this programme already exist. Kantelhardt and colleagues' multifractal detrended fluctuation analysis separates scaling associated with broad distributions from that associated with temporal correlations. Wavelet analysis has been used in peer-reviewed sentiment research, including Gherghina, Mehdian and Stoica's 2023 pandemic-era study. Hamilton's regime-switching framework models transitions among latent states. These are established methods for particular tasks, not validations of Elliott. (21, 22, 23)
Dynamic time warping could compare candidate shapes while allowing local stretching; here that is a proposed test, and excessive alignment flexibility would itself need penalising. Fractal-dimension estimates describe roughness, not causes. Hidden Markov models could test whether a constrained wave sequence adds predictive value beyond unconstrained regimes. Agent-based simulations could compare mechanisms capable of generating similar statistical patterns. Their role is to distinguish explanations, not supply impressive names around a preselected conclusion.
Socionomics requires an additional experiment. Measure mood through timestamped surveys, text and behavioural choices before observing the events to be explained. Keep the dimensions separate until evidence justifies combining them. Compare mood-to-price, price-to-mood and common-news accounts; hold out countries and future periods. For culture, define the sampling and coding before selecting emblematic songs or films. For politics, specify outcomes and lags before elections occur.
A series that predicts another in the Granger sense contains incremental lagged information. It does not automatically reveal a causal mechanism. Natural experiments or well-justified interventions can identify narrower effects; no single correlation can validate the entire social-mood thesis.
Most of all, publish the failures. A flexible count that changes with new evidence may be a useful interpretive practice. A predictive claim must also preserve what it said before the evidence changed.
What survives the scrutiny
The strongest insight shared by the books is that collective behaviour deserves an explanation at its own level. Individual intentions do not simply add up to a transparent social outcome. Feedback, imitation, heterogeneous horizons and constraints can create structures no participant planned.
Modern research gives substantial reasons to study those processes. It also offers several competing mechanisms. Fractality can coexist with uncertainty about direction. Sentiment can correlate with prices, sometimes contain forward information, and still change its relationship across periods. Endogenous instability can coexist with responses to external news.
The more specific claims remain less secure. This review did not find convincing independent evidence establishing Elliott's full grammar as a reliably superior forecasting law, Fibonacci relationships as generally calibrated targets, or an autonomous mood process as the dominant cause of political and cultural history. That is a conclusion about the evidence located, not a proof that no useful wave-based model could ever exist.
The intellectual value of these books need not depend on granting their largest claims. They make an ordinary chart feel like a question about emergence, explanation and the limits of knowledge. The next step is to make that question precise enough that reality can answer back.
A pattern deserves attention when it organises what we see. It earns predictive trust only when it helps us with what we have not yet seen.
Research and source notes
Research cutoff: 2 November 2026. This is a targeted narrative review prioritising 2022–2026 research, with older foundations where necessary, not a systematic review or a new trading backtest. Both supplied scans were processed in full and substantive chapters examined; page references below use their printed pagination. Recent papers vary in methods and cannot be treated as interchangeable tests. For Jarusek et al., access was limited to the abstract and publisher section excerpts; other access limits are noted in the bibliography. Proposed experiments above have not been run. The original diagrams are conceptual; no book figure has been reproduced.
Bibliography
-
Frost, A. J., and Robert R. Prechter Jr. (2005). Elliott Wave Principle: Key to Market Behavior. Tenth edition, New Classics Library; supplied scan copyright through 2006. Book 1 in the text; printed and PDF page numbers coincide.
-
Prechter, Robert R. Jr. (1999; supplied fourth printing, 2009). The Wave Principle of Human Social Behavior and the New Science of Socionomics. New Classics Library. Book 2 in the text; PDF page = printed page + 7.
-
Mandelbrot, Benoit, Adlai Fisher and Laurent Calvet (1997). A Multifractal Model of Asset Returns. Cowles Foundation Discussion Paper 1164, Yale University. Source.
-
Peters, Edgar E. (1994). Fractal Market Analysis: Applying Chaos Theory to Investment and Economics. Wiley. Author's publication record. Source.
-
Takaishi, Tetsuya (2025). Multifractality and sample size influence on Bitcoin volatility patterns. Finance Research Letters 74, 106683. DOI: 10.1016/j.frl.2024.106683; linked author manuscript. Source.
-
Batchelor, Roy, and Richard Ramyar (2006). Magic numbers in the Dow. Cass Business School working paper. Institutional full text; not a peer-reviewed journal article. Source.
-
Mignot, Sarah, and Frank Westerhoff (2025; online 2024). Explaining the Stylized Facts of Foreign Exchange Markets with a Simple Agent-based Version of Paul de Grauwe's Chaotic Exchange Rate Model. Computational Economics 65, 845–876. Source.
-
Bikhchandani, Sushil, David Hirshleifer and Ivo Welch (1992). A Theory of Fads, Fashion, Custom, and Cultural Change as Informational Cascades. Journal of Political Economy 100(5), 992–1026. Source.
-
Andersen, Torben G., Tim Bollerslev, Francis X. Diebold and Clara Vega (2007). Real-time price discovery in global stock, bond and foreign exchange markets. Journal of International Economics 73(2), 251–277. DOI: 10.1016/j.jinteco.2007.02.004; linked 2006 Federal Reserve working-paper version. Source.
-
Prechter, Robert R. Jr., Deepak Goel, Wayne D. Parker and Matthew Lampert (2012). Social Mood, Stock Market Performance, and U.S. Presidential Elections: A Socionomic Perspective on Voting Results. SAGE Open 2(4). Proponent-authored research. Source.
-
Ketovuori, Mikko, and Matt Lampert (2018). From ‘Hard Rock Hallelujah’ to ‘Ukonhauta’ in Nokialand: a socionomic perspective on the mood shift in Finland's popular music from 2006 to 2009. Popular Music 37(2), 237–252. Abstract-level access; proponent involvement. Source.
-
Baker, Malcolm, and Jeffrey Wurgler (2007). Investor Sentiment in the Stock Market. Journal of Economic Perspectives 21(2), 129–152. Source.
-
Edmans, Alex, Adrian Fernandez-Perez, Alexandre Garel and Ivan Indriawan (2022). Music sentiment and stock returns around the world. Journal of Financial Economics 145(2), 234–254. DOI: 10.1016/j.jfineco.2021.08.014; author's published PDF. Source.
-
Weiberg, Alicia, and Jan Heldmann (2026). Music sentiment and stock returns: A structural break in sentiment dynamics. Finance Research Letters 102, 110071. DOI: 10.1016/j.frl.2026.110071; institutional published PDF. Source.
-
Xiang, Lan, and Wenzhao Wang (2026). Investor sentiment and stock market returns: A comparative analysis of mood, word, and trade. Journal of Financial Research, early view, 18 May. Source.
-
Borgioli, Stefano, Giampiero M. Gallo and Chiara Ongari (2024). Financial returns, sentiment and market volatility. A dynamic assessment. ECB Working Paper 2999. DOI: 10.2866/3237842. Working paper; authors' views, not an ECB endorsement. Source.
-
Jarusek, Robert, Eva Volna and Martin Kotyrba (2022). FOREX rate prediction improved by Elliott waves patterns based on neural networks. Neural Networks 145, 342–355. Abstract and publisher section excerpts accessed; full methods not independently audited. Source.
-
Swetha, B., and Kriti Arya (2026). Automated Detection of Elliott Wave Patterns Using LSTM Autoencoders and Multi-Domain Feature Fusion. IEEE Access 14, 74426–74449. Published 14 May; full-paper text inspected via its ResearchGate copy. Source.
-
Westland, J. Christopher (2024). Periodicity, Elliott waves, and fractals in the NFT market. Scientific Reports 14, 4480. Source.
-
Lopez-Lira, Alejandro, and Yuehua Tang (2026). Can ChatGPT forecast stock price movements? Return predictability and large language models. Journal of Financial Economics 184, 104335. Published-version abstract and indexed publisher excerpts; distinguish from earlier working-paper versions. Source.
-
Kantelhardt, Jan W., and colleagues (2002). Multifractal detrended fluctuation analysis of nonstationary time series. Physica A 316, 87–114. DOI: 10.1016/S0378-4371(02)01383-3; linked author manuscript. Source.
-
Gherghina, Ștefan Cristian, Seyed Mehdian and Ovidiu Stoica (2023). Investors’ sentiment and equity markets during COVID-19 period: a quantile regression approach and wavelet analysis. Journal of Business Economics and Management 24(3), 551–575. Source.
-
Hamilton, James D. (1989). A New Approach to the Economic Analysis of Nonstationary Time Series and the Business Cycle. Econometrica 57(2), 357–384. DOI: 10.2307/1912559; author's publication index links paper, data and software. Source.
-
Clauset, Aaron, Cosma Rohilla Shalizi and M. E. J. Newman (2009). Power-law distributions in empirical data. SIAM Review 51(4), 661–703. DOI: 10.1137/070710111; linked author manuscript. Source.
-
Bak, Per, Chao Tang and Kurt Wiesenfeld (1987). Self-organized criticality: An explanation of the 1/f noise. Physical Review Letters 59(4), 381–384. Source.